
THE POTENTIAL OF COMBINING HRV AND PWA TO OPTIMISE WORKLOAD REGENERATION
2024. April 18, Thursday 16:05 | Scientific background
To date, the readiness methodology known in the club system and used in individual sports has been based on CMJ and HRV measurements. In order to draw the right conclusions, all tests to determine the current state should be carried out every day of the week to monitor the necessary trends. HRV analysis is a way of determining the current state of the nervous system. HRV (heart rate variability) measurement is a non-invasive method to assess the variability of heart rate (R-R distances measured in milliseconds). HRV values are used to determine the status of heart rate regulation. This is particularly important in the study of stress, fatigue and sleep disorders, and in the interpretation of autonomic nervous system responses to exercise in athletes and is essential for optimising exercise recovery. HRV analysis allows a deeper understanding of the interactions between the nervous system and the heart. The application of the criteria for HRV methodology in team sports has been very difficult so far, as all athletes had to wear a chest strap after waking up and it was essential to wear it at rest.
Thus, with the previous method we have drawn the main conclusions solely from autonomic nervous system regulation, but in sports laboratory conditions the application of PWA technology and methodology is an important complementary investigation, as the vascular status of our athletes is crucial for achieving maximum performance.
Overview of the scientific background
But what is PWA? Pulse Wave Analysis (PWA) is a technique to evaluate arterial waveforms and to derive different haemodynamic parameters from the pulse pressure waveform. "Pulse wave analysis (PWA) allows estimation of cardiac output (CO) based on continuous analysis of the arterial blood pressure (AP) waveform" [12] (CO=cardiac output; AP=arterial pressure). Non-invasive recording of the pulse wave was performed using a pumpable cuff placed on the finger or arm, inflated and deflated at the appropriate time. " Noninvasive PWA systems are either based on the volume clamp method using a finger-cuff or on automated radial artery applanation tonometry using a sensor placed on the skin over the radial artery.." [12; 29]

PWA and HRV measurement became an important tool in cardiological testing and diagnostics from the mid-20th century onwards. During this period, rapid advances in science and technology have made it possible to understand cardiovascular diseases, diagnose them more accurately and treat them more effectively. The links that have been discovered are also helping sports professionals and athletes to avoid overwork, overstrain and burnout. Avoiding burnout is also important in the lives of managers and executives. It follows from the above that it would be optimal to use a methodology that is quick, simple and easy to understand.
The methodology indicated uses the optical measurement technique of photoplethysmography (PPG) to detect blood-induced changes. "(PPG) is a noninvasive method to detect the blood volume changes in tissues by photoelectric means. This method is based on the Lambert-Beer law [11], which indicates that the light passing through the blood tissue will be attenuated by the length of the propagation path, the density of the tissue, the absorbance, and other factors. The blood volume varies periodically with the blood ejection of the heart, as does the light intensity through the skin." [26][27]
Using the PPG principle, cardiovascular parameters such as heart rate, blood pressure changes and oxygen saturation can be measured. In summary, it may be a suitable method for PWA, but PPG systems to date have been dominantly capable of determining R-R distances, with varying degrees of success. The Fit4all instrument (200 Hz) and its associated system exploit the potential of the aforementioned PPG. The tool and methodology allow the benefits of the HRV and PWA systems to be exploited without significant time and extra technological effort. In short: small device, only one pulse oximeter (Figure 1), mobile app, short data acquisition (140 seconds), instant results.
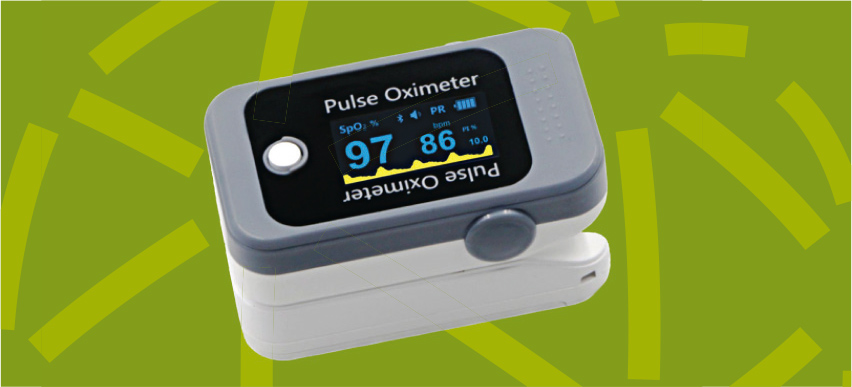
Figure 1: Fit4all PWR (Pulse Wave Recorder) device with PPG (photoplethysmography)
The methodology is based on the ability of the device to generate an accurate, scientifically useful, reference point transformation from a curve with PPG limits, which is nothing more than a double derivative of the recorded PPG (Figure 2). The single derivative obtained represents the "slope" of the curve, the double derivative represents the "acceleration" of the original curve.
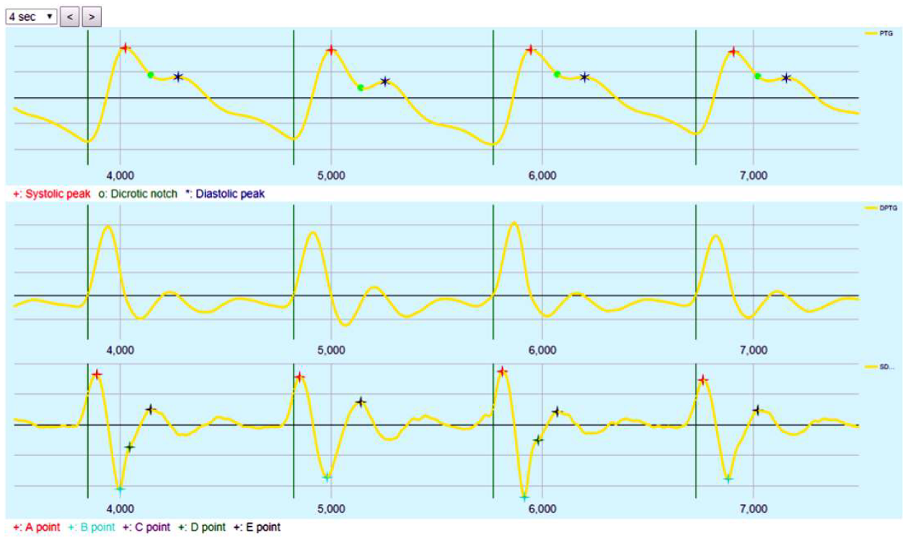
Figure 2: Pulse power curve (PPG), middle: first derivative of PPG, bottom: double derivative of PPG
A number of salient points and derivative parameters are available to describe the morphology of waves. [1] (Figure 3)
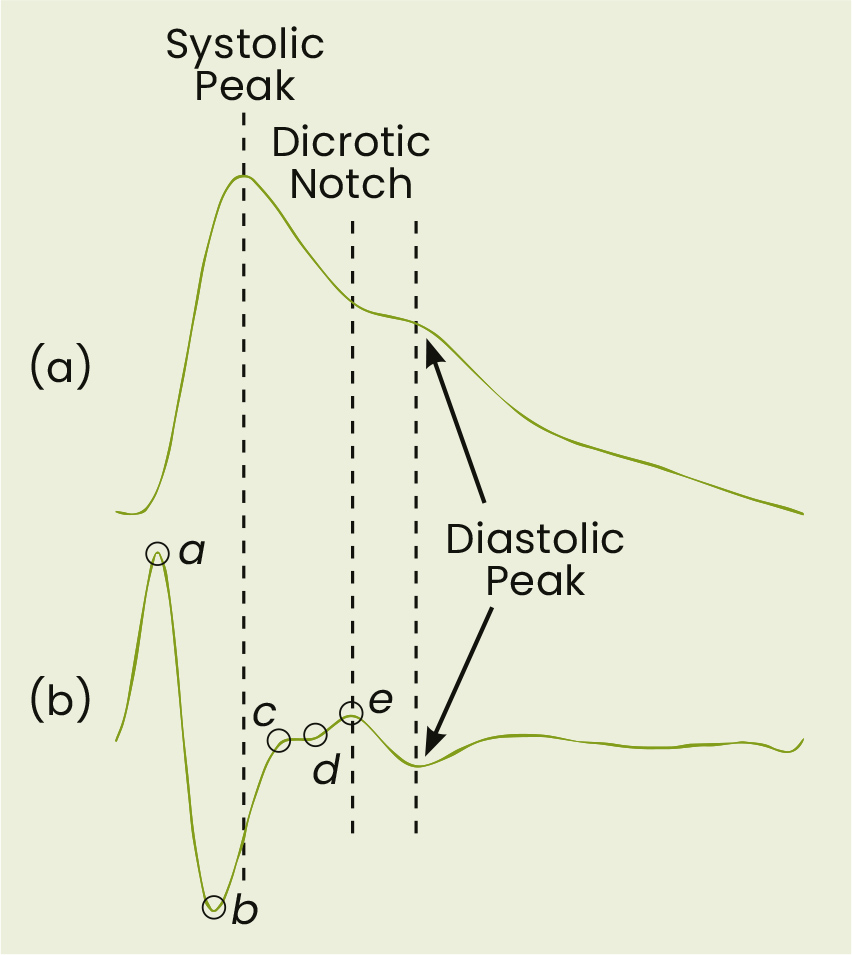
Figure 3: Feature points for the calculation of derivatives [1]
Due to the two methods in one tool and the advanced automatic analysis system, we have the parameter set of both methods at our disposal. This gives an accurate picture of the individual's autonomic nervous system regulation and the current state of his/her vascular system, which may become more understandable later on as the variables are understood. It is important to point out that, for ease of interpretation, all variables are expressed in percentiles, i.e. the range of values is divided into 100 equal units, and all values are on a scale of 0-100, so that the values are meaningful to the average person, since they are presented in the same dimension. The same dimension is important so that the values can be displayed within a coordinate system for longitudinal analysis, which shows trends. It follows from the foregoing that the evaluator does not need to know the unit of measurement and the normal range associated with the units of measurement.
Parameters calculated from the PPG curve
STIFFNESS INDEX
Provides information on the stiffness of the arteries. [7]
SI=h/deltaT. deltaT: time between systolic and diastolic peak, h: patient height.
MUSCLE TONE (REFLECTION INDEX)
Peak diastolic amplitude/peak systolic amplitude x100 - the resultant marker of the stiffness of the aorta and the aorta. The value calculated from the ratio of diastolic to systolic peak amplitude as a percentage. This index gives a complex picture of the tone of the vessel walls and the elasticity of the aorta. The higher the value, the better the muscle tone and aortic elasticity. [3]
DICROTIC NOTCH INDEX
A measure of the relationship between the second peak and the preceding trough in the blood pressure curve at a particular point in the heartbeat. It is shaped by the signal observed when the aortic valve closes. This measure provides information about the state of the cardiovascular system and generally decreases with age. However, there are certain factors - such as targeted cardiovascular exercise, sauna use or hot baths - that can affect its value in the short term and improve cardiac performance.
CARDIAC DYNAMICS
Defines the maximum slope of the upward wave. This correlates with the left ventricular ejection dynamics (~dP/dt echocardiography), i.e. the more the left ventricle contracts, the steeper the pressure build-up in the vasculature. Cardiac dynamics is an indicator of the rate at which blood pressure increases during the systolic (contractile) phase of the heart. The systolic slope (alpha) is a measure of how rapidly pressure increases at this point in the cardiac cycle. The more efficiently the left ventricle contracts, the faster the pressure increases, which indicates a steep slope on the curve. This value is related to the efficiency of the left ventricle's ejection and the transfer of force throughout the body. Put simply, it is an indication of how forcefully and efficiently the heart is pumping, which affects the performance of exercises during exercise.
BIOLOGICAL AGE (AGEING INDEX)
Derived from the second derivative of the PPG wave, its absolute value decreases with age. It is related to the true arterial age of the body. [2]
Biological age, also known as ageing index, is the value calculated from the second derivative of the pulse wave graph (PPG). This figure shows the extent to which the vascular network has aged over time. The lower this value, the younger the vascular system is considered to be. This index helps us to understand how well the vascular condition of an athlete corresponds to his or her actual age and can help us to tailor training plans and recovery strategies. A healthy lifestyle, proper training and good nutrition can help to slow down arterial ageing and thus maintain the athlete's performance.

METABOLISM (CREST TIME)
Time from the start of the period to maximum systolic amplitude corrected to 75/min heart rate. This indicator refers to the rate and changes in metabolic rate.
One indicator of metabolic rate is crest time, which measures the time elapsed between the start of the pulse wave period and the maximum systolic amplitude, standardised to a heart rate of 75 beats/minute. This is a measure of how quickly the body can react and adapt to changing demands during exercise. In short, this value reflects the efficiency and speed of the athlete's metabolic processes, which directly affect energy production and performance during training or competition. The ideal crest time indicates that the athlete's metabolism is responding well to the workload and is capable of rapid energy delivery.
CARDIAC STRAIN/OVERTRAINING
There are two time components of crest time (left ventricular ejection time): LVET1, LVET2. During LVET1 the heart does not have to cope with the consequences of afterload, whereas in LVET2 afterload can play a significant role in shaping the length of this time interval. The two indicators can be used to determine the degree of cardiac workload or possible overload. Two important elements of cardiac strain or overwork are LVET1 and LVET2 measurements, which are determined normalised to a heart rate of 75 beats/min. LVET1 is the phase of the heartbeat when the heart is not yet feeling the effects of resistance, or afterload. This period focuses mainly on the heart's own contractility. In contrast, LVET2 indicates the period when the heart has to cope with the resistance, which has a significant impact on the heart's performance.
In simple terms, these measurements show how much stress the heart is under before and after exercise and whether there are signs of overload. If LVET1 and LVET2 values are high, it may indicate that the heart is having to work harder, which could be a sign of increased stress or overload. This information will help coaches to properly regulate training load and active rest, thus protecting the health and long-term performance of the athlete.
In addition to the parameters mentioned above, the measurement also gives the average heart rate (HR) and arterial oxygen saturation (SpO2).
HEART RATE VARIABILITY (HRV)
The 140 second PPG record also allows the analysis of HRV (heart rate variability). HRV parameters also provide valuable information about the general state of the heart and its autonomic nervous regulation. For example, in diabetic patients, where vagal activity is reduced, a characteristic pattern of HRV parameters can be observed that differs from that of healthy individuals (cardiac autonomic neuropathy (CAN) [9].
For the HRV analysis, the system used the recommendations described and adopted by the international cardiology organizations in 1996, with minor modifications. [10] The analysis of the time and frequency domain and of the non-linear parameters is performed according to specific mathematical rules. HRV analysis has been used in several articles to estimate the risk of patients who have undergone infarction. [10,11]
HRV (SDNN)
Of the many HRV parameters, the most widely known [10] is the SDNN. Its value is influenced by all cyclical components that affect heart rate variability. It is a quasi-summative autonomic nervous system indicator. Higher in young people and athletes, lower in people under stress and those with unhealthy lifestyles.
SDNN is one of the most commonly used HRV (heart rate variability) indicators, measuring the standard deviation of all NN intervals. It reflects the cyclical effects that influence heart rate variability and is a summary indicator of autonomic nervous system activity.
Young, physically active people and athletes tend to have higher SDNN values because their hearts and nervous systems are more flexible and better adapted to different physical and mental challenges. On the other hand, people who are stressed or overworked, overstressed or have a less healthy lifestyle may have a lower SDNN, which may indicate that the heart is less responsive to changing demands.
As a trainer, SDNN can help assess the impact of exercise programmes and identify any overload or need for rest. By monitoring SDNN, the intensity of training can be optimised, helping to keep athletes healthy and improve performance.
REGENERATION (RMSSD)
The parasympathetic activity of the autonomic nervous system affects its value in direct proportion. Its value refers to the degree of regeneration. The rMSSD is an indicator of regeneration heart rate variability, the root mean square of successive differences. It is directly related to the activity of the parasympathetic part of the autonomic nervous system, i.e. the part of the nervous system that supports resting state. The higher the rMSSD value, the stronger the parasympathetic activity, indicating that the body is undergoing intense regeneration and rest.
The rMSSD value can help a coach to assess where an athlete is in the recovery process after a training session or competition. With high rMSSD values, an athlete is rested and ready for the next training session or challenge. Low values may indicate a need for further rest or a review of recovery strategies such as improving nutrition, hydration, sleep management or stress management.
TOTAL POWER
Indicates the area under the frequency domain analysis curve. It carries similar information as SDNN and the factors affecting its value are the same. Its value refers to the current energy level of the body.
The energy level, often referred to as "total power" in HRV analysis, represents the area under the power spectrum curve in frequency domain analysis. This value indicates the level of activity of the autonomic nervous system and thus refers to the current energy level of the athlete.
As with the SDNN, the energy level gives a comprehensive picture of cardiac variability, but here by summing the whole frequency spectrum. A higher value means that the athlete is more energetic and more likely to be ready for physical activity. However, a lower value may indicate fatigue or insufficient recovery.
For coaches, this information can be important in adjusting the intensity of training and in assessing the athlete's daily condition and readiness. Monitoring "overall performance" can help to ensure that the athlete is in the best possible condition for training and competition.
NERVOUS SYSTEM BALANCE (LF/HF)
This is a number describing the ratio between different frequency bands from the HRV frequency domain analysis. The LF- (low frequency: 0.04 Hz-0.15 Hz) component is affected by both sympathetic and parasympathetic effects, while the HF- (high frequency: 0.15 Hz-0.4 Hz) component is only affected by an increase in parasympathetic activity. Consequently, the ratio of the two approximates whether the sympathetic or parasympathetic effects of the autonomic nervous system are stronger in a given individual at the time of measurement. The LF/HF ratio measures the activity of the sympathetic and parasympathetic parts of the autonomic nervous system on a percentage (percentile) scale. This ratio indicates which nervous system state of the body is predominant at the time of measurement. A LF/HF ratio of about 50 percent indicates a balance between the sympathetic and parasympathetic components of the nervous system. If the value is below the 50th percentile, it indicates a predominance of parasympathetic (calming, regenerative) activity, while above the 50th percentile it indicates a predominance of sympathetic (activating, stress response) activity. This indicator is particularly important for coaches, as it helps them to find the right balance between training and rest, and to identify periods when the athlete may be under excessive stress or, on the contrary, when he or she has recovered. Tracking the percentile value of the LF/HF ratio helps to fine-tune training intensity and maximise the athlete's performance.
The tool and system are currently being tested by the National Handball Academy. In our experience, such a simple and short data capture has not yet provided such a comprehensive picture of our athletes' current fitness levels. We have found it difficult to apply longitudinal readiness testing in team sports, but after testing the system we find the procedure easy and good to use.
Based on Selye's stress theory [32], by interpreting the sympathetic-parasympathetic responses of the autonomic nervous system [28] (Figure 4) and the fatigue-overload-exhaustion responses and mechanisms of action, the ratio of training load (which we need to interpret as stress) [30; 31] to rest can be more accurately interpreted and optimized, and the stimulus strength (range, intensity) can be more precisely defined.
Practical experience
The measurements were taken daily, after the players woke up. It is important to emphasise that data should always be collected after waking up, because the more stimuli the subject is exposed to, the more the measurement parameters are influenced, which are indicative of the actual state at that time. The most important measurement day was the day of the match and the two days preceding it. For a single inadequate ('bad') measurement result, no load was adjusted unless this value was measured on one of the priority days, that day in the case of a Saturday match, or on Thursday or Friday. For results on Monday, Tuesday and Wednesday, we only adjusted if we did not get the expected values on at least two days.

In general, after a higher load, the measurements on the next day were less close to optimal. The variation of the parameters was interpreted in a matrix, however, the main deviations due to load/stress were observed. Examples include hypertrophy after exercise; athletes also reported muscle soreness, with a decrease in isometric tone. However, in many cases there were no significant changes in parameters of large artery stiffness and cardiac stress/overload. Following a regeneration programme (10-20 min cyclic aerobic, Normatec, massage, cold therapy, meditation, breathing exercises), the values normalised in most cases. Measurement results were interpreted in combination with other readiness tests, such as wellness questionnaire and CMJ (mod. RSI, height imp-mom.). This supplement can be used to determine daily current form/status and also to avoid overtiredness. Information is obtained on the state of equilibrium of the nervous system or the direction of its possible shift, the type of fatigue (nervous or cardiovascular), so that this can be influenced by modifying the intensity, volume indicators or even by incorporating different breathing exercises, alternative recovery methods. In addition, we can observe the effect of different periodisation blocks, training types/objectives (endurance, hypertrophy, strength, speed, explosiveness, etc.). Examples include whether the shift of the ACWR (Acute Chronic Workload Ratio) load index in the acute direction during the baseline period is of the right magnitude and induces the desired markers of the inflammation characteristics, and whether these values are only present for a sufficient period of time. Knowledge and control of these values is of paramount importance during the season to ensure that the athlete is in match-to-match form, and if the aim is to improve performance during the season, accurate knowledge of these data is essential to untwist the tongue of the performance adaptation scale for the right length of time and to the right extent.
In the future, it would be worthwhile to investigate the correlation between the different subjective and objective measures of readiness, the strength of their effects and the relationship and relevance of performance/success in the match, as well as the effect of nervous tone on the ability to agility.
In summary, the test methodology presented above opens up a number of new possibilities for improving periodisation in team sports. The objective method provides the possibility to interpret and optimise the response to exercise, to study the effects of recovery techniques and their effects on the vascular and nervous systems, and to detect physiological changes caused by the psychological and emotional effects on the athlete.
Published in Handball Methodology journal Nr. 6., 2024/01.
Illustration: Freepik
Literature
[1] Elgendi M. On The Analysis of fingertip photoplethysmogram signals. CurrCardiolRev. 2012; 8: 14–25.
[2] Takazawa K, Tanaka N, Fujita M, et al. Assessment of vasoactive agents and vascular aging by the second derivative of photoplethysmogram waveform. Hypertension. 1998; 32: 365–370.
[3] Millasseau S, Kelly R, Ritter J, et al. Determination of age-related increases in large artery stiffness by digital pulse contour analysis. ClinSci. 2002; 103: 371–377.
[4] Wesselink R. Blood Pressure Waveform Analysis in cardiogenic shock & acute myocardial infarction. 2016;
[5] Pilt K, Meigas K, Ferenets R, et al. Photoplethysmographic Signal Waveform index for detection of increased arterial stiffness. PhysiolMeas. 2014; 35: 2027–2036.
[6] Inoue N, Kawakami H, Yamamoto H, et al. Second Derivative of the finger photoplethysmogram and cardiovascular mortality in middle-aged and elderly Japanese women. Hypertens Res. 2017; 40: 207–211.
[7] Millasseau SC, Ritter JM, Takazawa K, et al. Contour Analysis of the photoplethysmographic pulse measured at the finger. J Hypertens. 2006; 24: 1449–1456.
[8] Haiden A, Eber B, Weber T. U-Shaped Relationship of Left Ventricular Ejection Time Index and All-Cause Mortality. Am J Hypertens. 2014; 27: 702–709.
[9] Fisher VL, Tahrani AA. Cardiac Autonomic Neuropathy in patients with diabetes mellitus: current perspectives. Diabetes MetabSyndrObes. 2017; 10: 419–434.
[10] TaskForce of the European Society of Cardiology and theNorth American Society of Pacing and Electrophysiology. Heart Rate Variability: standards of measurement, physiological interpretation and clinical use. Circulation. 1996; 93: 1043–1065.
[11] Karp E, Shiyovich A, Zahger D, et al. Ultra-Short-Term Heart Rate Variability for Early Risk Stratification following Acute ST-Elevation Myocardial Infarction. Cardiology. 2009; 114: 275–283.
[12] Saugel, Bernd, Karim Kouz, Thomas W.L. Scheeren et al. Cardiac output estimation using pulse wave analysis—physiology, algorithms, and technologies: a narrative review. British Journal of Anaesthesia, Volume 126, Issue 1, 67 - 76
[13] Bedford, D. E., The ancient art of feeling the pulse. Br. Heart J. 1951; 13, 423–437.
[14] Hyndman, B. W., Kitney, R. I., and Sayers, B. M. 1971; Spontaneous rhythms in physiological control systems. Nature 233, 339–341.
[15] Sayers, B. M., Analysis of heart rate variability. Ergonomics 1973;16, 17–32.
[16] Peñáz, J., Honzikova, N., and Fisher, B.,Spectral analysis of resting variability of some circulatory paramers in man. Physiol. Bohemoslov. 1978;27, 349–357.
[17] Huikuri, H. V., Mäkikallio, T. H., Airaksinen, K. E., Seppänen, T., Puukka, P., Räiha, I. J., and Sourander, L. B., Power-law relationship of heart rate variability as a predictor of mortality in the elderly. Circulation 1998; 97, 2031–2036.
[18] Plews DJ, Laursen PB, Kilding AE, Bucheit M., Heart-rate variability and training-intensity distribution in elite rowers., 2014.
[19] Vaz MS, Picanco LM, Del Vecchio FB., Effects of different training amplitudes on heart rate and heart rate variability in young rowers. 2014.
[20] Park SB, Lee BC, Jeong KS, Standardized tests of heart rate variability for autonomic function tests in healthy Koreans. 2007.
[21] Nunan D, Sandercoc GR, Brodie DA., A quantitative systematic review of normal values for short-term heart rate variability in healthy adults. 2010.
[22] Andreas Voss , Rico Schroeder, Andreas Heitmann, Annette Peters, Siegfried Perz, Short-Term Heart Rate Variability - Influence of Gender and Age in Healthy Subjects 2015.
[23] Mourot L, Bouhaddi M, Perrey S, Capelle S, Henriet MT, Wolf JP, Rouillon JD, Regnard J., Decrease in heart rate variability with overtraining: assessment by the Poincaré plot analysis. 2004.
[24] Richard P Sloan, PhD, Mei-Hua Huang, DrPH, Heather Mccreath, PhD, Stephen Sidney, MD, Kiang Liu, PhD, O. Dale Williams, Teresa Seeman, PhD, Cardiac Autonomic control and the effects of age, race and sex: the cardia study. 2008.
[25] M. Cejnar, H. Kobler, and S. N. Hunyor, Quantitative photoplethysmography: Lambert-Beer law or inverse function incorporating light scatter, Journal of Biomedical Engineering, vol. 15, no. 2, pp. 151–154, 1993.
[26] J. Allen, Photoplethysmography and its application in clinical physiological measurement, Physiological Measurement, vol. 28, no. 3, pp. R1–39, 2007.
[27] Qin C, Wang X, Xu G, Ma X. Advances in Cuffless Continuous Blood Pressure Monitoring Technology Based on PPG Signals. Biomed Res Int. 2022 Oct 1;2022:8094351. doi: 10.1155/2022/8094351. PMID: 36217389; PMCID: PMC9547685.
[28 John M Karemaker] An introduction into autonomic nervous function To cite this article: 2017 Physiol. Meas. 38 R89
[29] Penáz J. Criteria for set point estimation in the volume clamp method of blood pressure measurement. Physiol Res. 1992;41(1):5-10. PMID: 1610779.
[30] Carfagno, David G. DO, CAQSM1; Hendrix, Joshua C. MS-III2. Overtraining Syndrome in the Athlete: Current Clinical Practice. Current Sports Medicine Reports 13(1):p 45-51, January/February 2014. | DOI: 10.1249/JSR.0000000000000027
[31] Cardoos, Nathan MD. Overtraining Syndrome. Current Sports Medicine Reports 14(3):p 157-158, May/June 2015. | DOI: 10.1249/JSR.0000000000000145
[32] SELYE H. Stress and the general adaptation syndrome. Br Med J. 1950 Jun 17;1(4667):1383-92. doi: 10.1136/bmj.1.4667.1383. PMID: 15426759; PMCID: PMC2038162.
[33] https://www.fit4all.health/hu-HU